1. Home
  2. Markets Updates
  3. [TEST] 2025 Bitcoin Eyes $92K After Bullish Surge 2025

[TEST] 2025 Bitcoin Eyes $92K After Bullish Surge 2025

21 November 2024

Share the article:

BTCUSDH4_21_November.png
Past performance is not indicative of future results. All historical data, including but not limited to returns, volatility, and other performance metrics, should not be construed as a guarantee of future performance 

BTCUSD on a 4-Hour Timeframe 


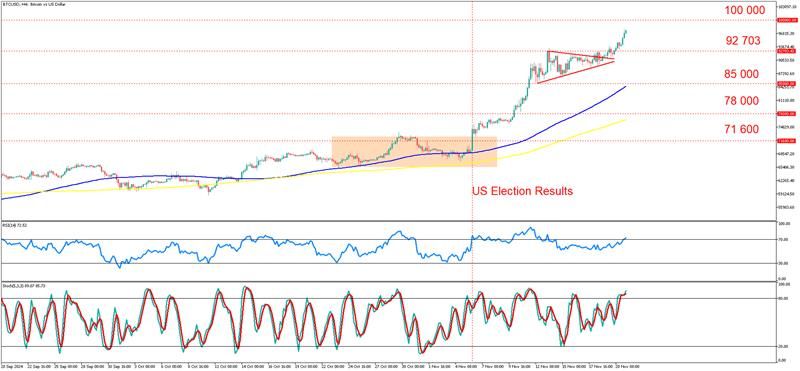
BTCUSD on a 4-hour timeframe shows a notable bullish breakout following a period of consolidation. Historically, Bitcoin has demonstrated resilience at key support levels, most recently at $71,600. The price action since late September indicates an upward trend supported by rising institutional interest, with the market showing strong bullish momentum as it moved past $78,000 and consolidated briefly before its current breakout. The chart highlights the influence of major news events, such as the U.S. election results, which appear to have bolstered confidence in the cryptocurrency market. 

The recent price action saw Bitcoin forming a triangle pattern above $85,000, which broke to the upside, confirming bullish continuation. This move propelled Bitcoin towards its next significant resistance at $92,703, a key psychological and technical level. The RSI has entered overbought territory at 72.5, while the Stochastic oscillator indicates strong bullish momentum but is also approaching overbought levels. Both suggest a potential pullback or consolidation in the short term. 

Technical indicators reinforce the bullish outlook. The 50-period moving average (blue) and the 200-period moving average (yellow) are sloping upwards, with the price remaining well above both, indicating strong underlying trend support. Additionally, Bitcoin's price action aligns with a surge in trading volumes, affirming the strength of the recent breakout. 

The primary scenario suggests Bitcoin is on course to test the $100,000 psychological resistance, with intermediate levels like $92,703 likely to act as staging points for further upward movement. Continuation above $100,000 would signal the potential for Bitcoin to enter uncharted territory, attracting further speculative and institutional interest. 

An alternative scenario envisions a retracement, particularly given overbought conditions on key momentum indicators. A pullback could see Bitcoin testing $85,000 or even $78,000 as support before resuming its upward trajectory. Failure to hold these levels might indicate a deeper correction, bringing $71,600 back into focus. 

Investors should remain cautious of potential profit-taking near all-time highs and monitor developments such as inflation and global economic uncertainty. While the bullish narrative remains dominant, heightened volatility and regulatory developments could create short-term disruptions. 

Summary: 

  • BTCUSD breaks $85K resistance, signaling strong bullish momentum. 
  • Overbought RSI and Stochastic suggest short-term consolidation risks. 
  • High trading volumes and bullish breakout target $100K psychological level. 
  • Key support at $85K, resistance levels at $92K and $100K. 
  • Sustained bullish trend could test uncharted territory above $100K. 
IMPORTANT NOTICE: Any news, opinions, research, analyses, prices or other information contained in this article are provided as general market commentary and do not constitute investment advice. The market commentary has not been prepared in accordance with legal requirements designed to promote the independence of investment research, and therefore, it is not subject to any prohibition on dealing ahead of dissemination. Past performance is not an indication of possible future performance. Any action you take upon the information in this article is strictly at your own risk, and we will not be liable for any losses and damages in connection with the use of this article.
RISK WARNING: CFDs are complex instruments and come with a high risk of losing money rapidly due to leverage. A high percentage of retail client investors lose money when trading CFDs with this provider. You should consider whether you understand how CFDs work and whether you can afford to take the high risk of losing your money.

Related articles

test article2
2 June 2025
test article2

Read more

test
18 March 2025
test description

Read more

Top Economic Events To Watch | November 18 – November 22 – 2024
18 November 2024
Find out here about the most important economic events of the coming week by exploring dependent assets.

Read more

Maxim Bohdan

Need Help? Visit our Help Section
Download NAGA Trader

Copyright © 2024 – All rights reserved.

NAGA is a trademark of The NAGA Group AG, a German based FinTech company publicly listed on the Frankfurt Stock Exchange | WKN: A161NR | ISIN: DE000A161NR7.

The website is operated by JME Financial Services (Pty) Ltd an authorised Financial Services Provider, regulated by the Financial Sector Conduct Authority in South Africa under license no. 37166. JME Financial Services (Pty) Ltd is located at Suite 10, 21 Lighthouse Rd 201 Beacon Rock, Umhlanga Rocks, Kwa-Zulu Natal, 4320, South Africa.

JME Financial Services (Pty) Ltd acts as an intermediary between the investor and NAGA Capital Ltd, the counterparty to the contract for difference purchased by the Investor via Naga.com/za. NAGA Capital Ltd is authorised and regulated by the Financial Services Authority Seychelles (FSA) under licence No. SD026. NAGA Capital Ltd is the principal to the CFD purchased by investors on this website. Other group entities: NAGA Markets Europe LTD which is authorised and regulated by the Cyprus Securities and Exchange Commission (CySEC) under licence No. 204/13.

RISK WARNING: Derivatives are complex instruments and come with a high risk of losing money rapidly due to leverage. You should consider whether you understand how derivatives work and whether you can afford to take the high risk of losing your money. The value of financial products can increase as well as decrease over time, depending on the value of the underlying securities and market conditions. Illustrations, forecasts or hypothetical data are not guaranteed and are provided for illustrative purposes only. JME Financial Services (Pty) Ltd does not render advice in respect of the CFD’s offered on this website. Before making an investment decision, you should rely on your own assessment. The Company’s disclaimer, conflict of interest policy are available on legal documents section.

Trading with NAGA Trader by following and/or copying or replicating the trades of other traders involves high levels of risks, even when following and/or copying or replicating the top-performing traders. Such risks include the risk that you may be following/copying the trading decisions of possibly inexperienced/unprofessional traders, or traders whose ultimate purpose or intention, or financial status may differ from yours. Before making an investment decision, you should rely on your own assessment of the person making the trading decisions and the terms of all the legal documentation.